
📊
Too complex for clients
Raw analytics tools overwhelm non-technical stakeholders. Sharing insights means exports, screenshots, and long calls.
Live visitors, visitor maps, top pages, traffic sources, and trends — in a dashboard your clients understand. Assign multiple websites per client and send weekly WhatsApp summaries automatically.
Most teams don't need complicated reports. They need the right numbers, explained clearly — without screenshots, exports, or long explanation calls every week.
Raw analytics tools overwhelm non-technical stakeholders. Sharing insights means exports, screenshots, and long calls.
Standard reports are delayed. You can't easily see who's on the site right now or which pages they're viewing.
Agencies manage multiple sites per client but have no simple branded portal to switch between them.
Clients still ask "how was last week?" because there's no simple weekly summary on WhatsApp.
Pick a module and preview the screen. Each section explains what the client sees and why it matters. Tap the screenshot to enlarge.
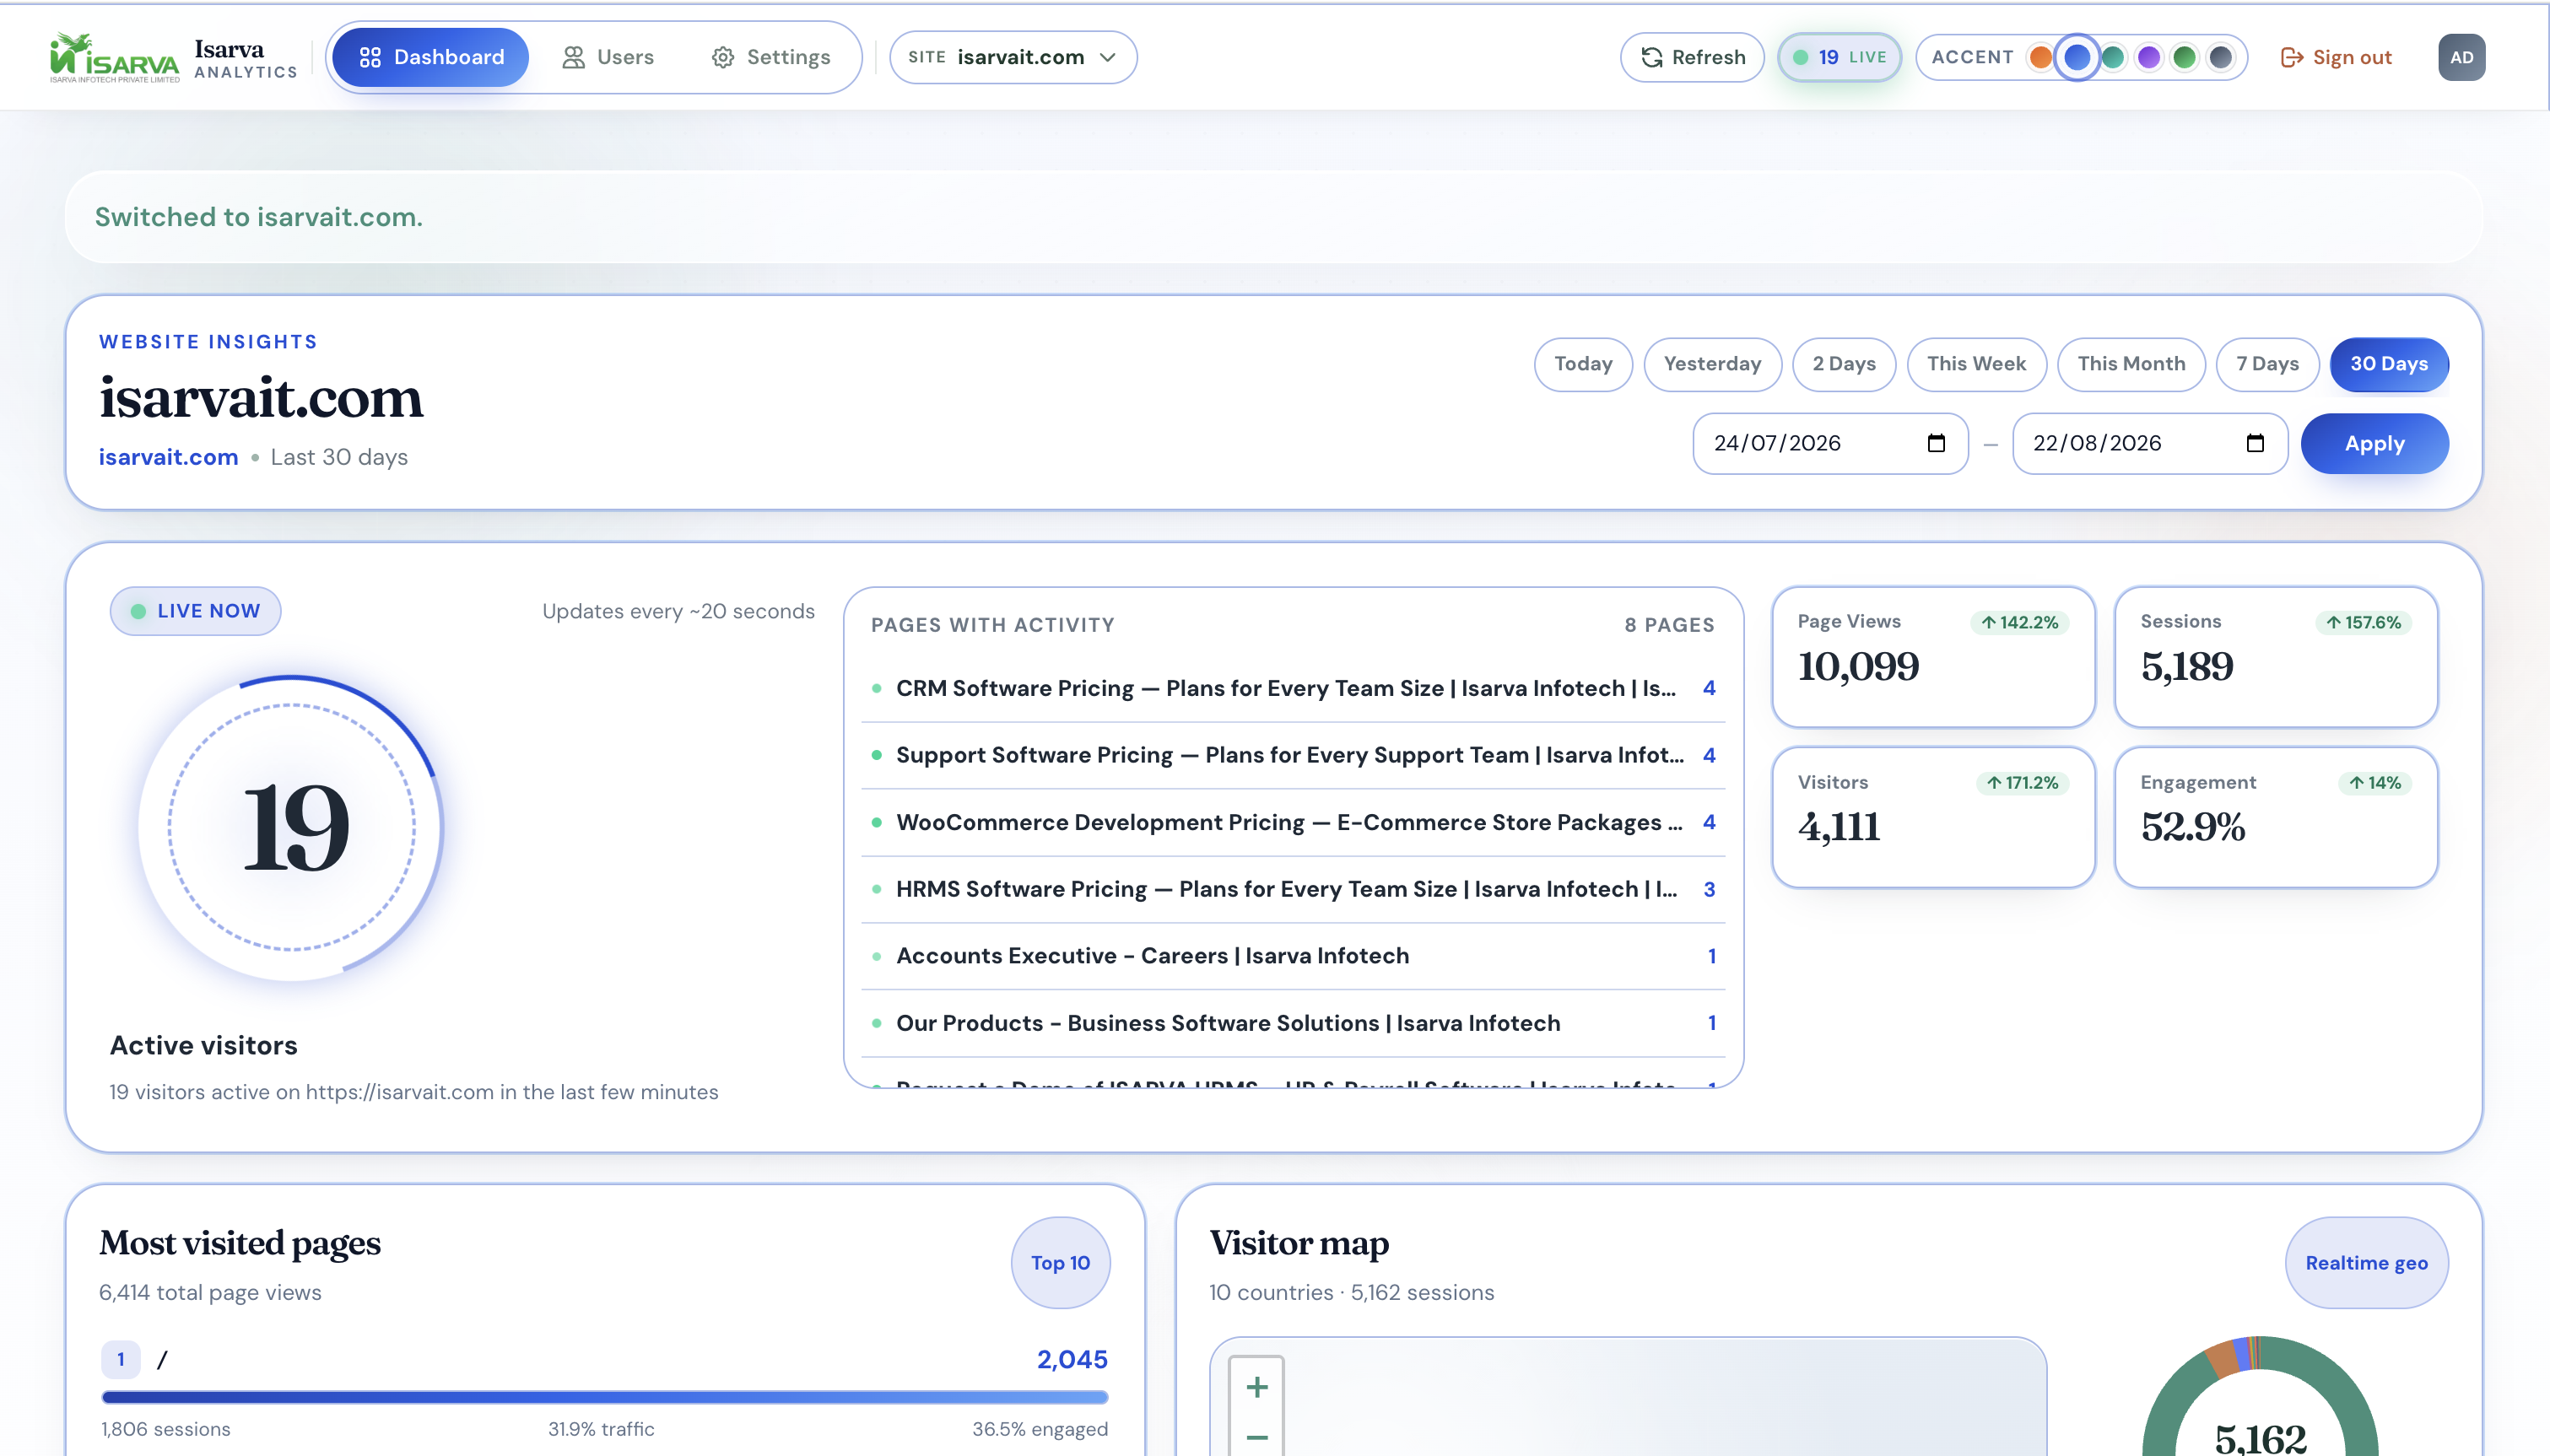
The main dashboard opens with a live visitor ring, a list of pages being viewed right now, and KPI cards showing page views, sessions, visitors, and engagement — each with % change vs the previous period.
Everything grouped the way clients think about their website — live activity, performance, and audience breakdown.
Who is on your site right now
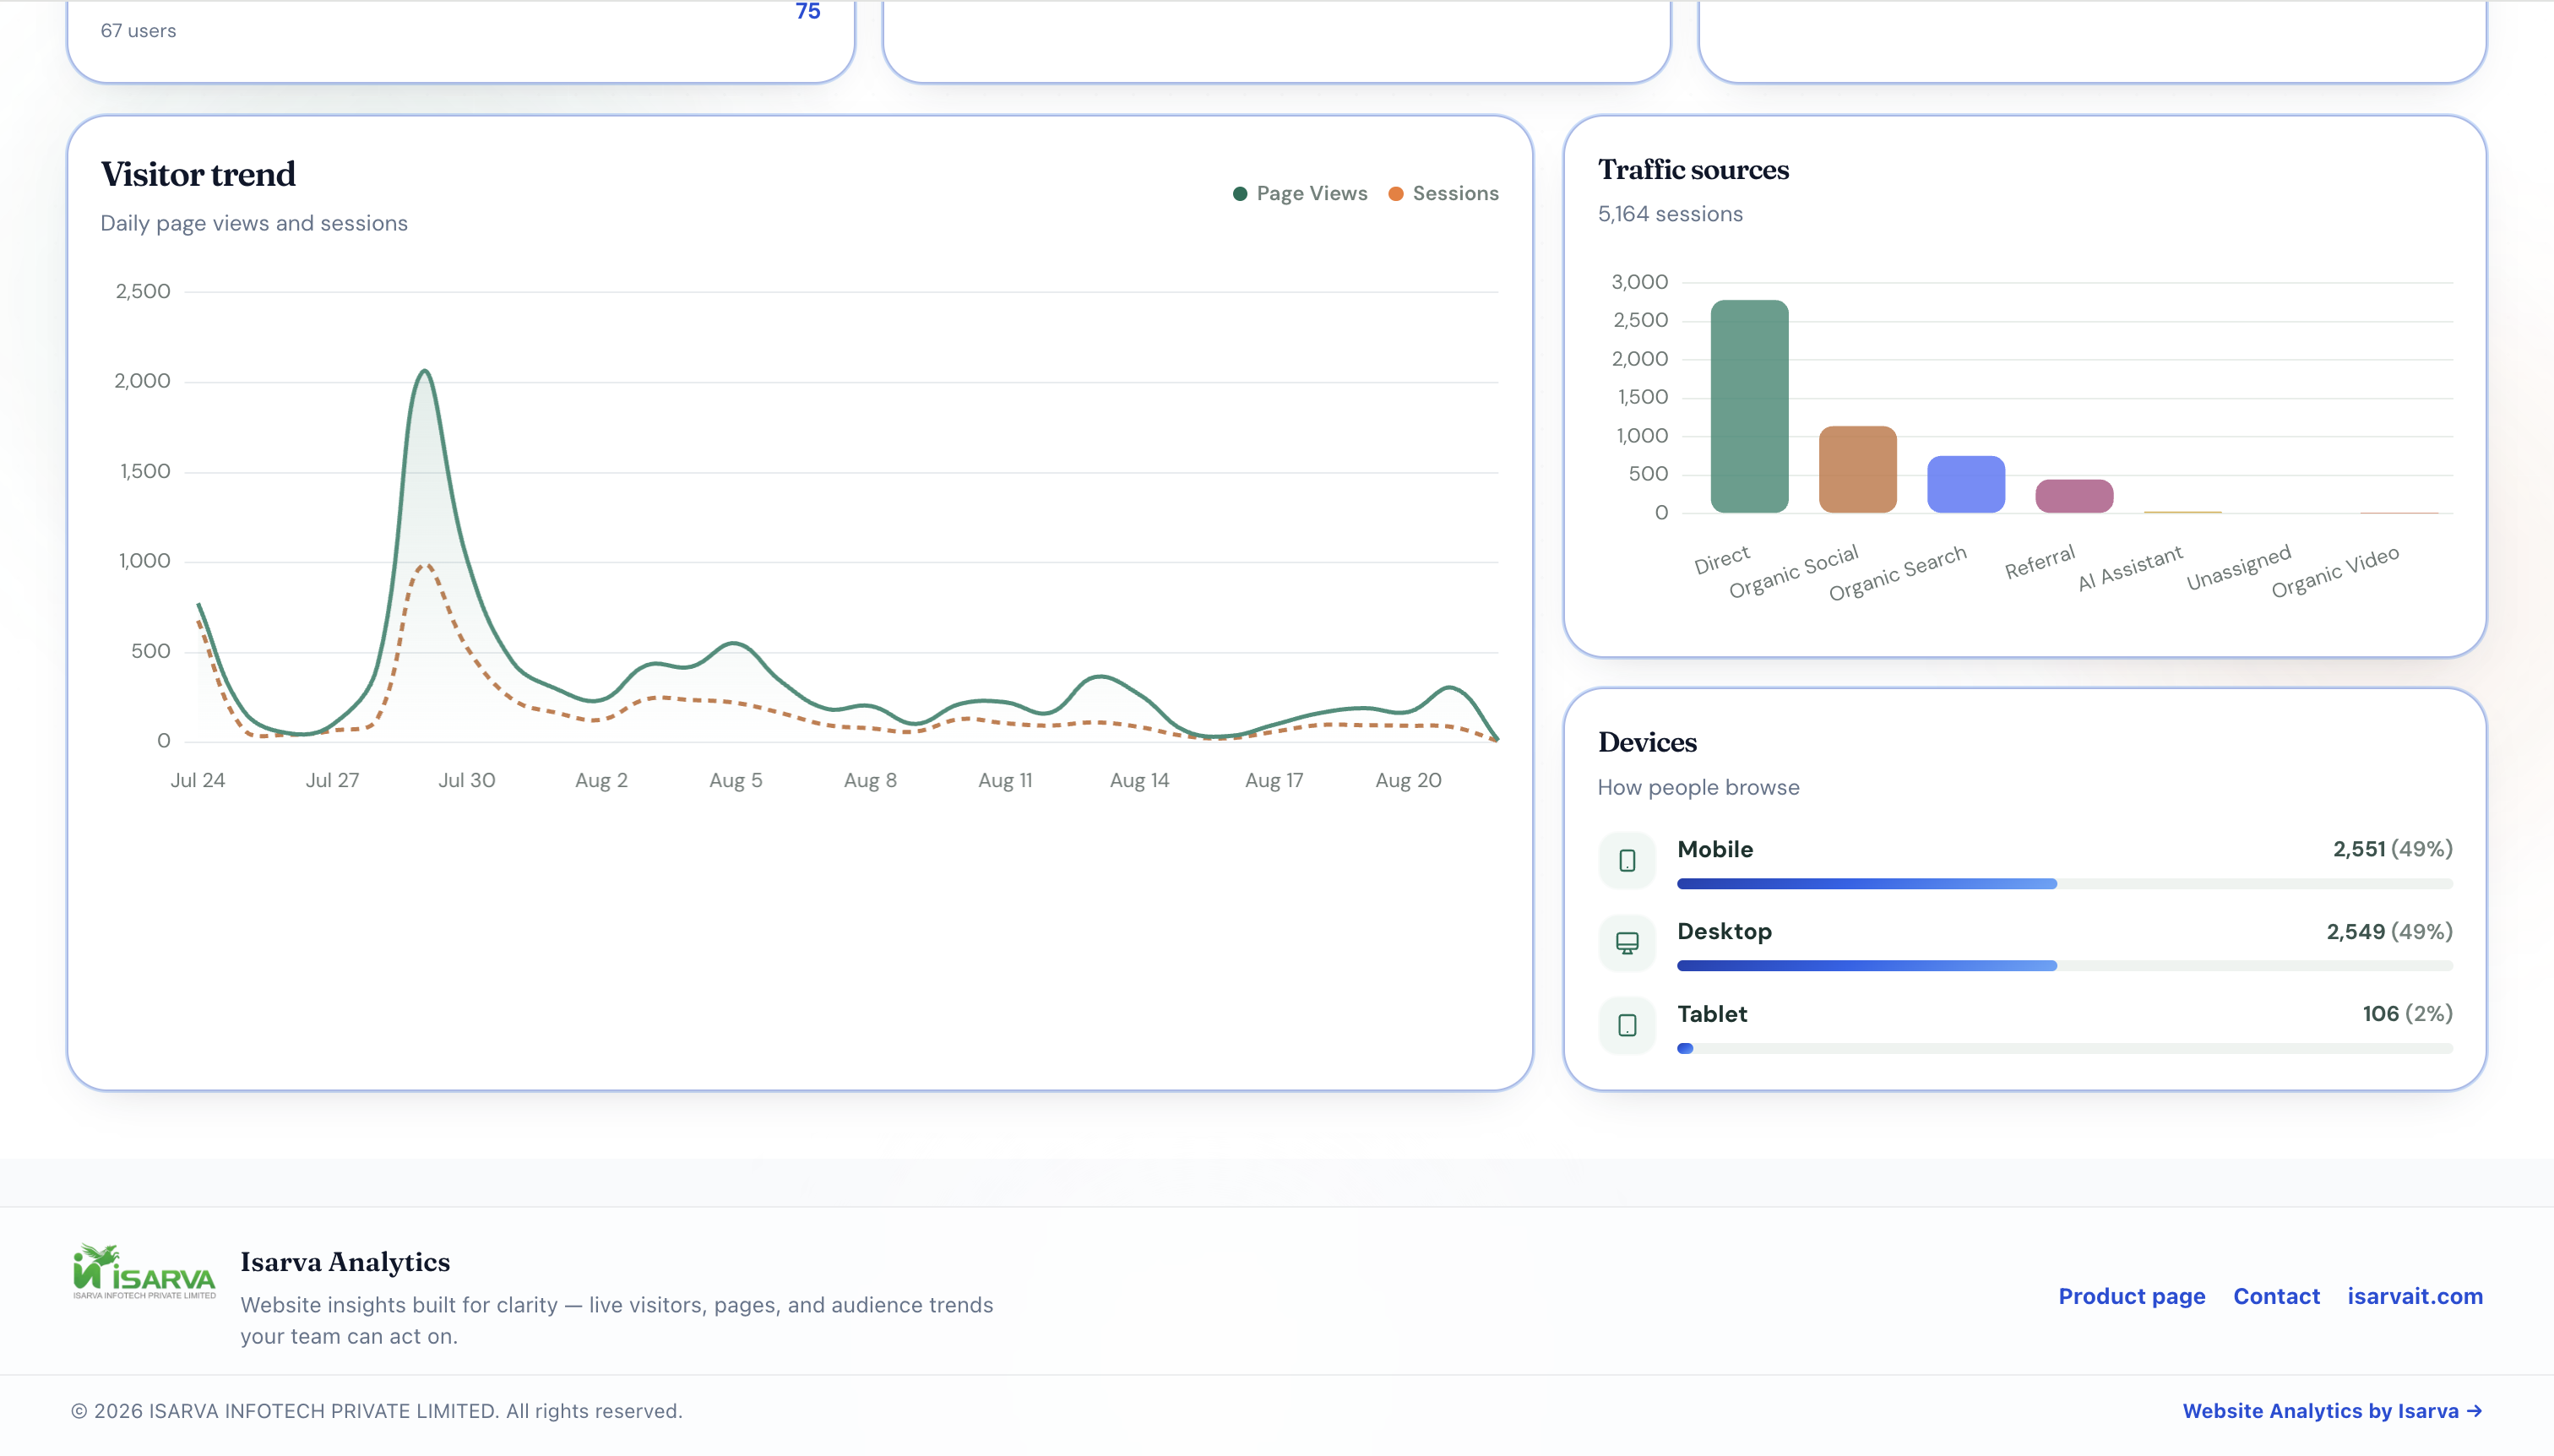
Historical metrics & trends
Sources, geography & devices
Every Monday, clients receive a friendly summary on WhatsApp — total visitors, top 3 pages, and top 3 countries. Plain language, no jargon. One message per website if they have multiple sites.
Clients only see Isarva Analytics — a clean dashboard with username and password. No third-party tools, no technical setup on their side.
Clients sign in with username and password you give them — like any professional product portal.
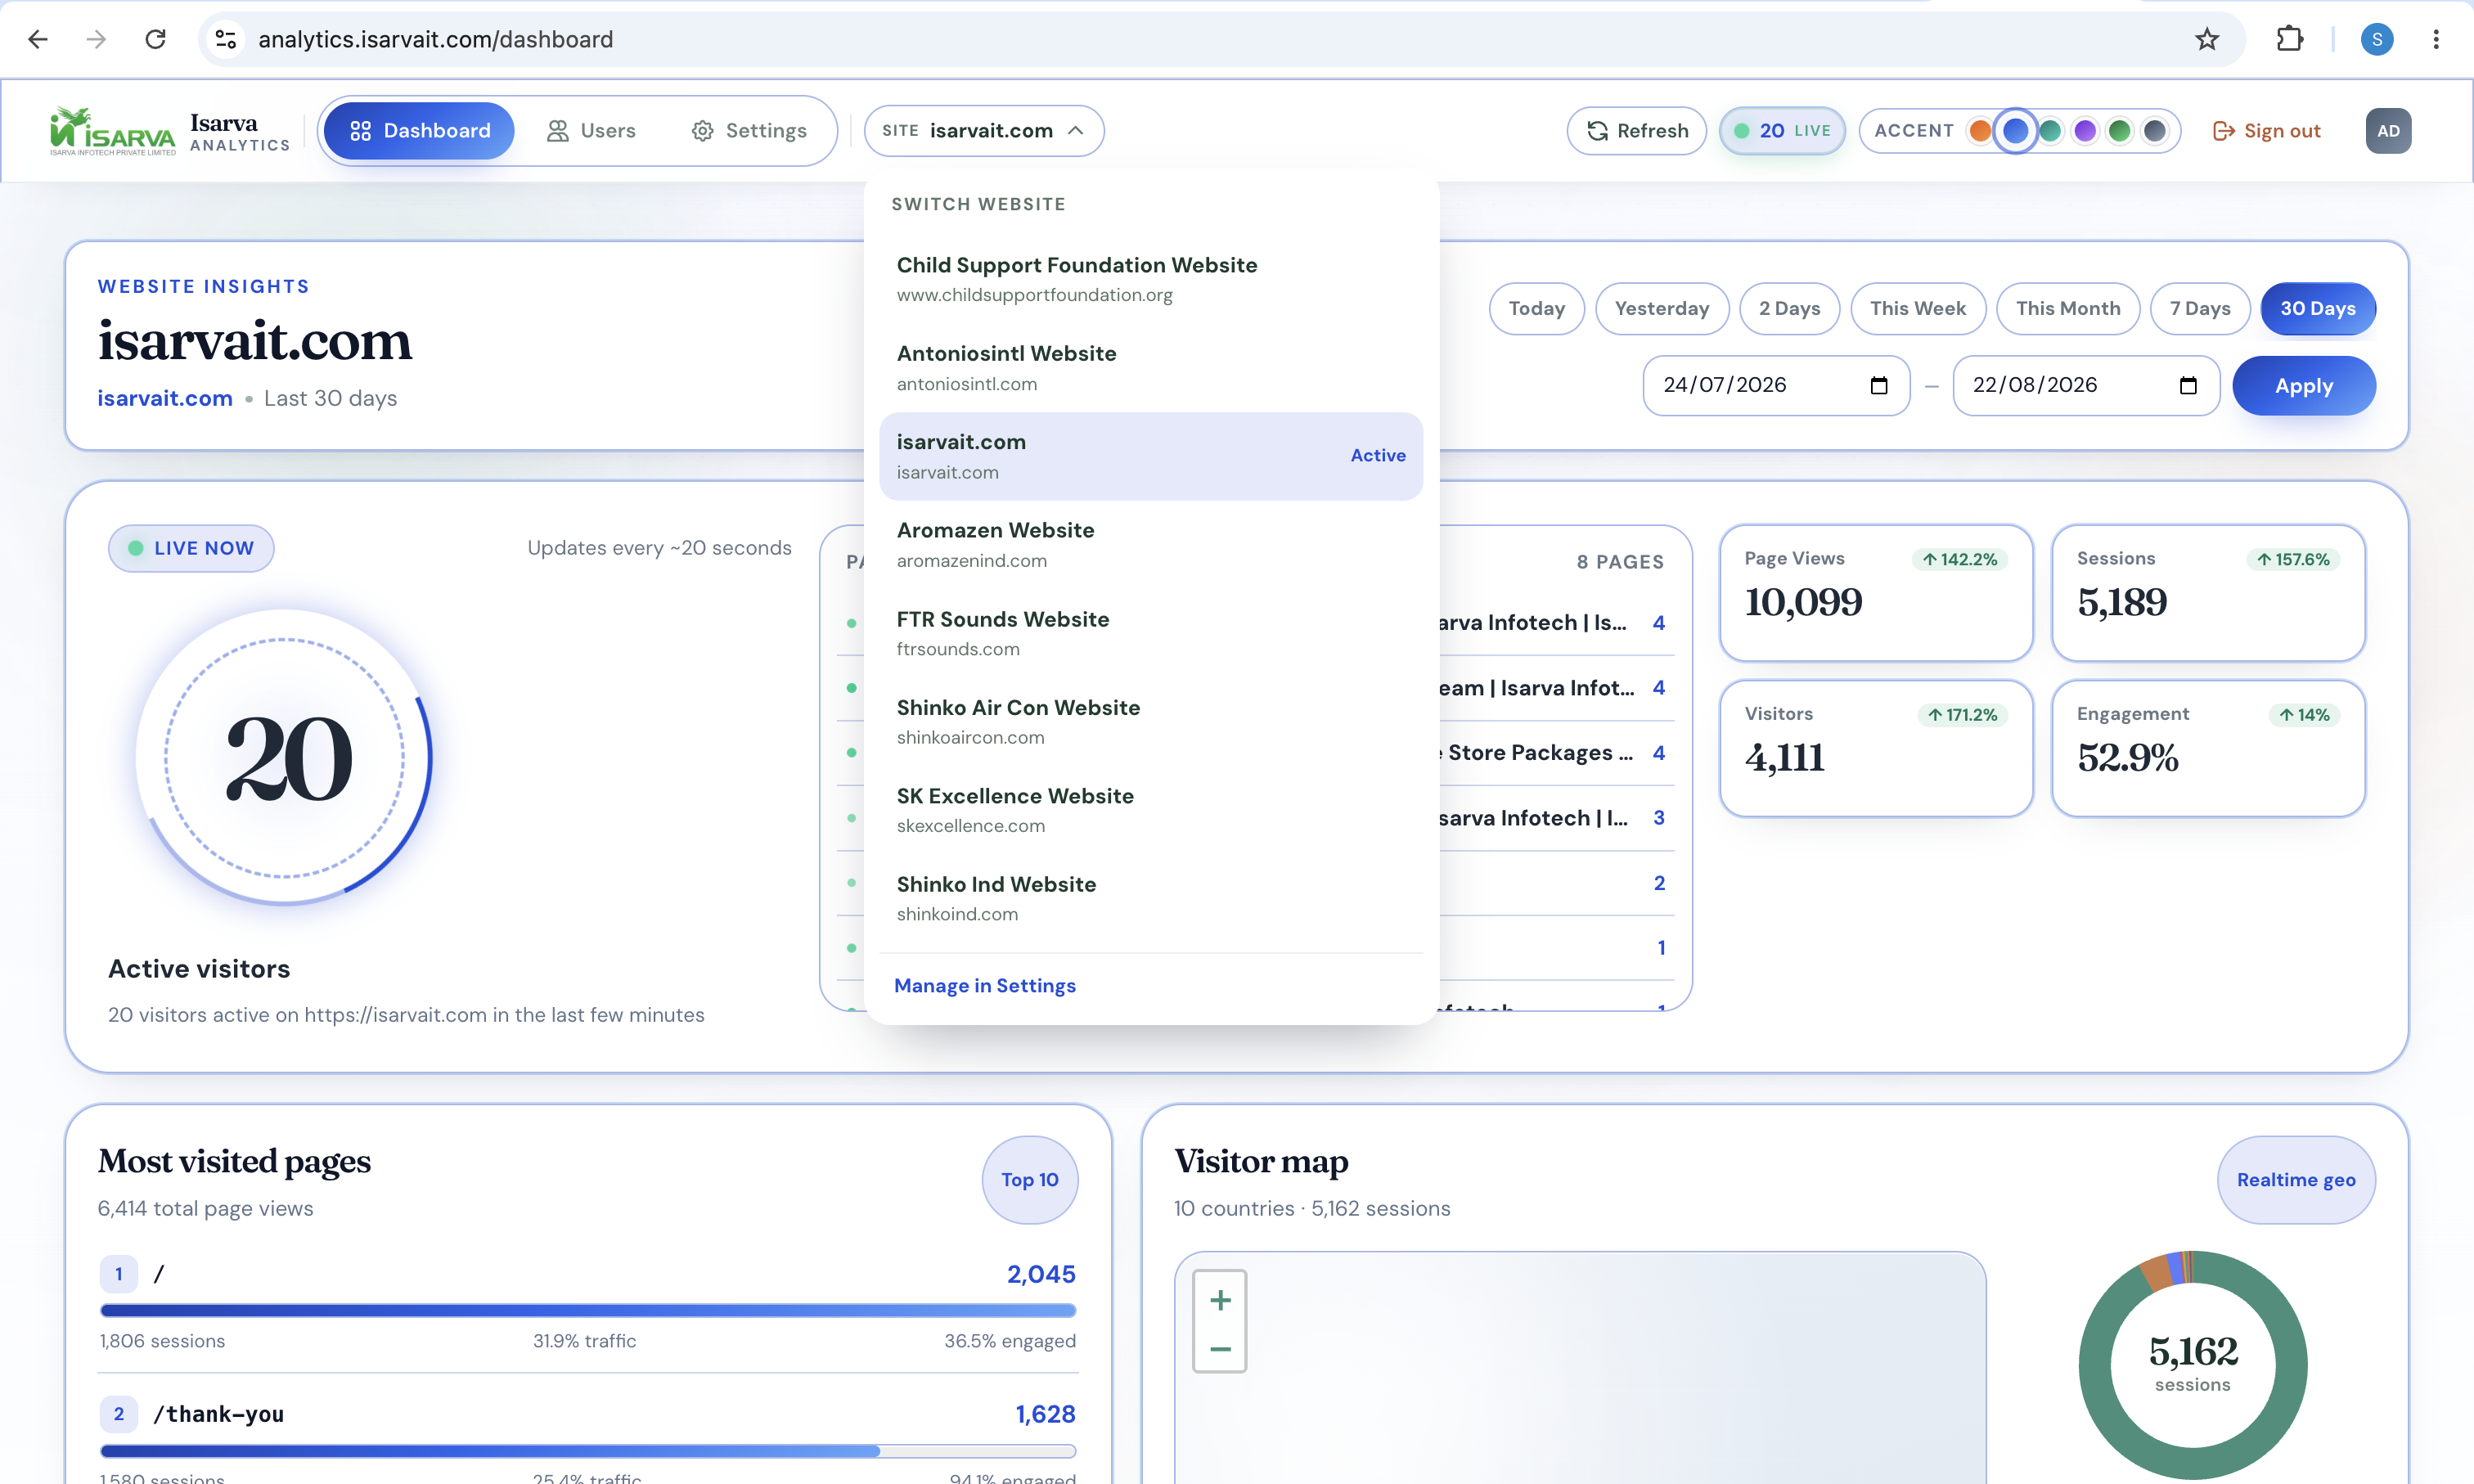
One client, many websites. They switch from the header dropdown — each site loads its own dashboard.
Add their mobile number — they get a weekly summary automatically. No need to open the dashboard to know how the week went.
Six glossy themes in the header — each user picks their favourite. Buttons, live ring, charts, and bars update instantly. Your Isarva logo stays the same.
Tap a colour to preview
Glossy Orange — warm and energetic, great for marketing teams.
Live stats every 30 seconds, full metrics every 5 minutes — no manual page reload required.
Today, yesterday, this week, this month, 7/30 days, or custom date range with one click.
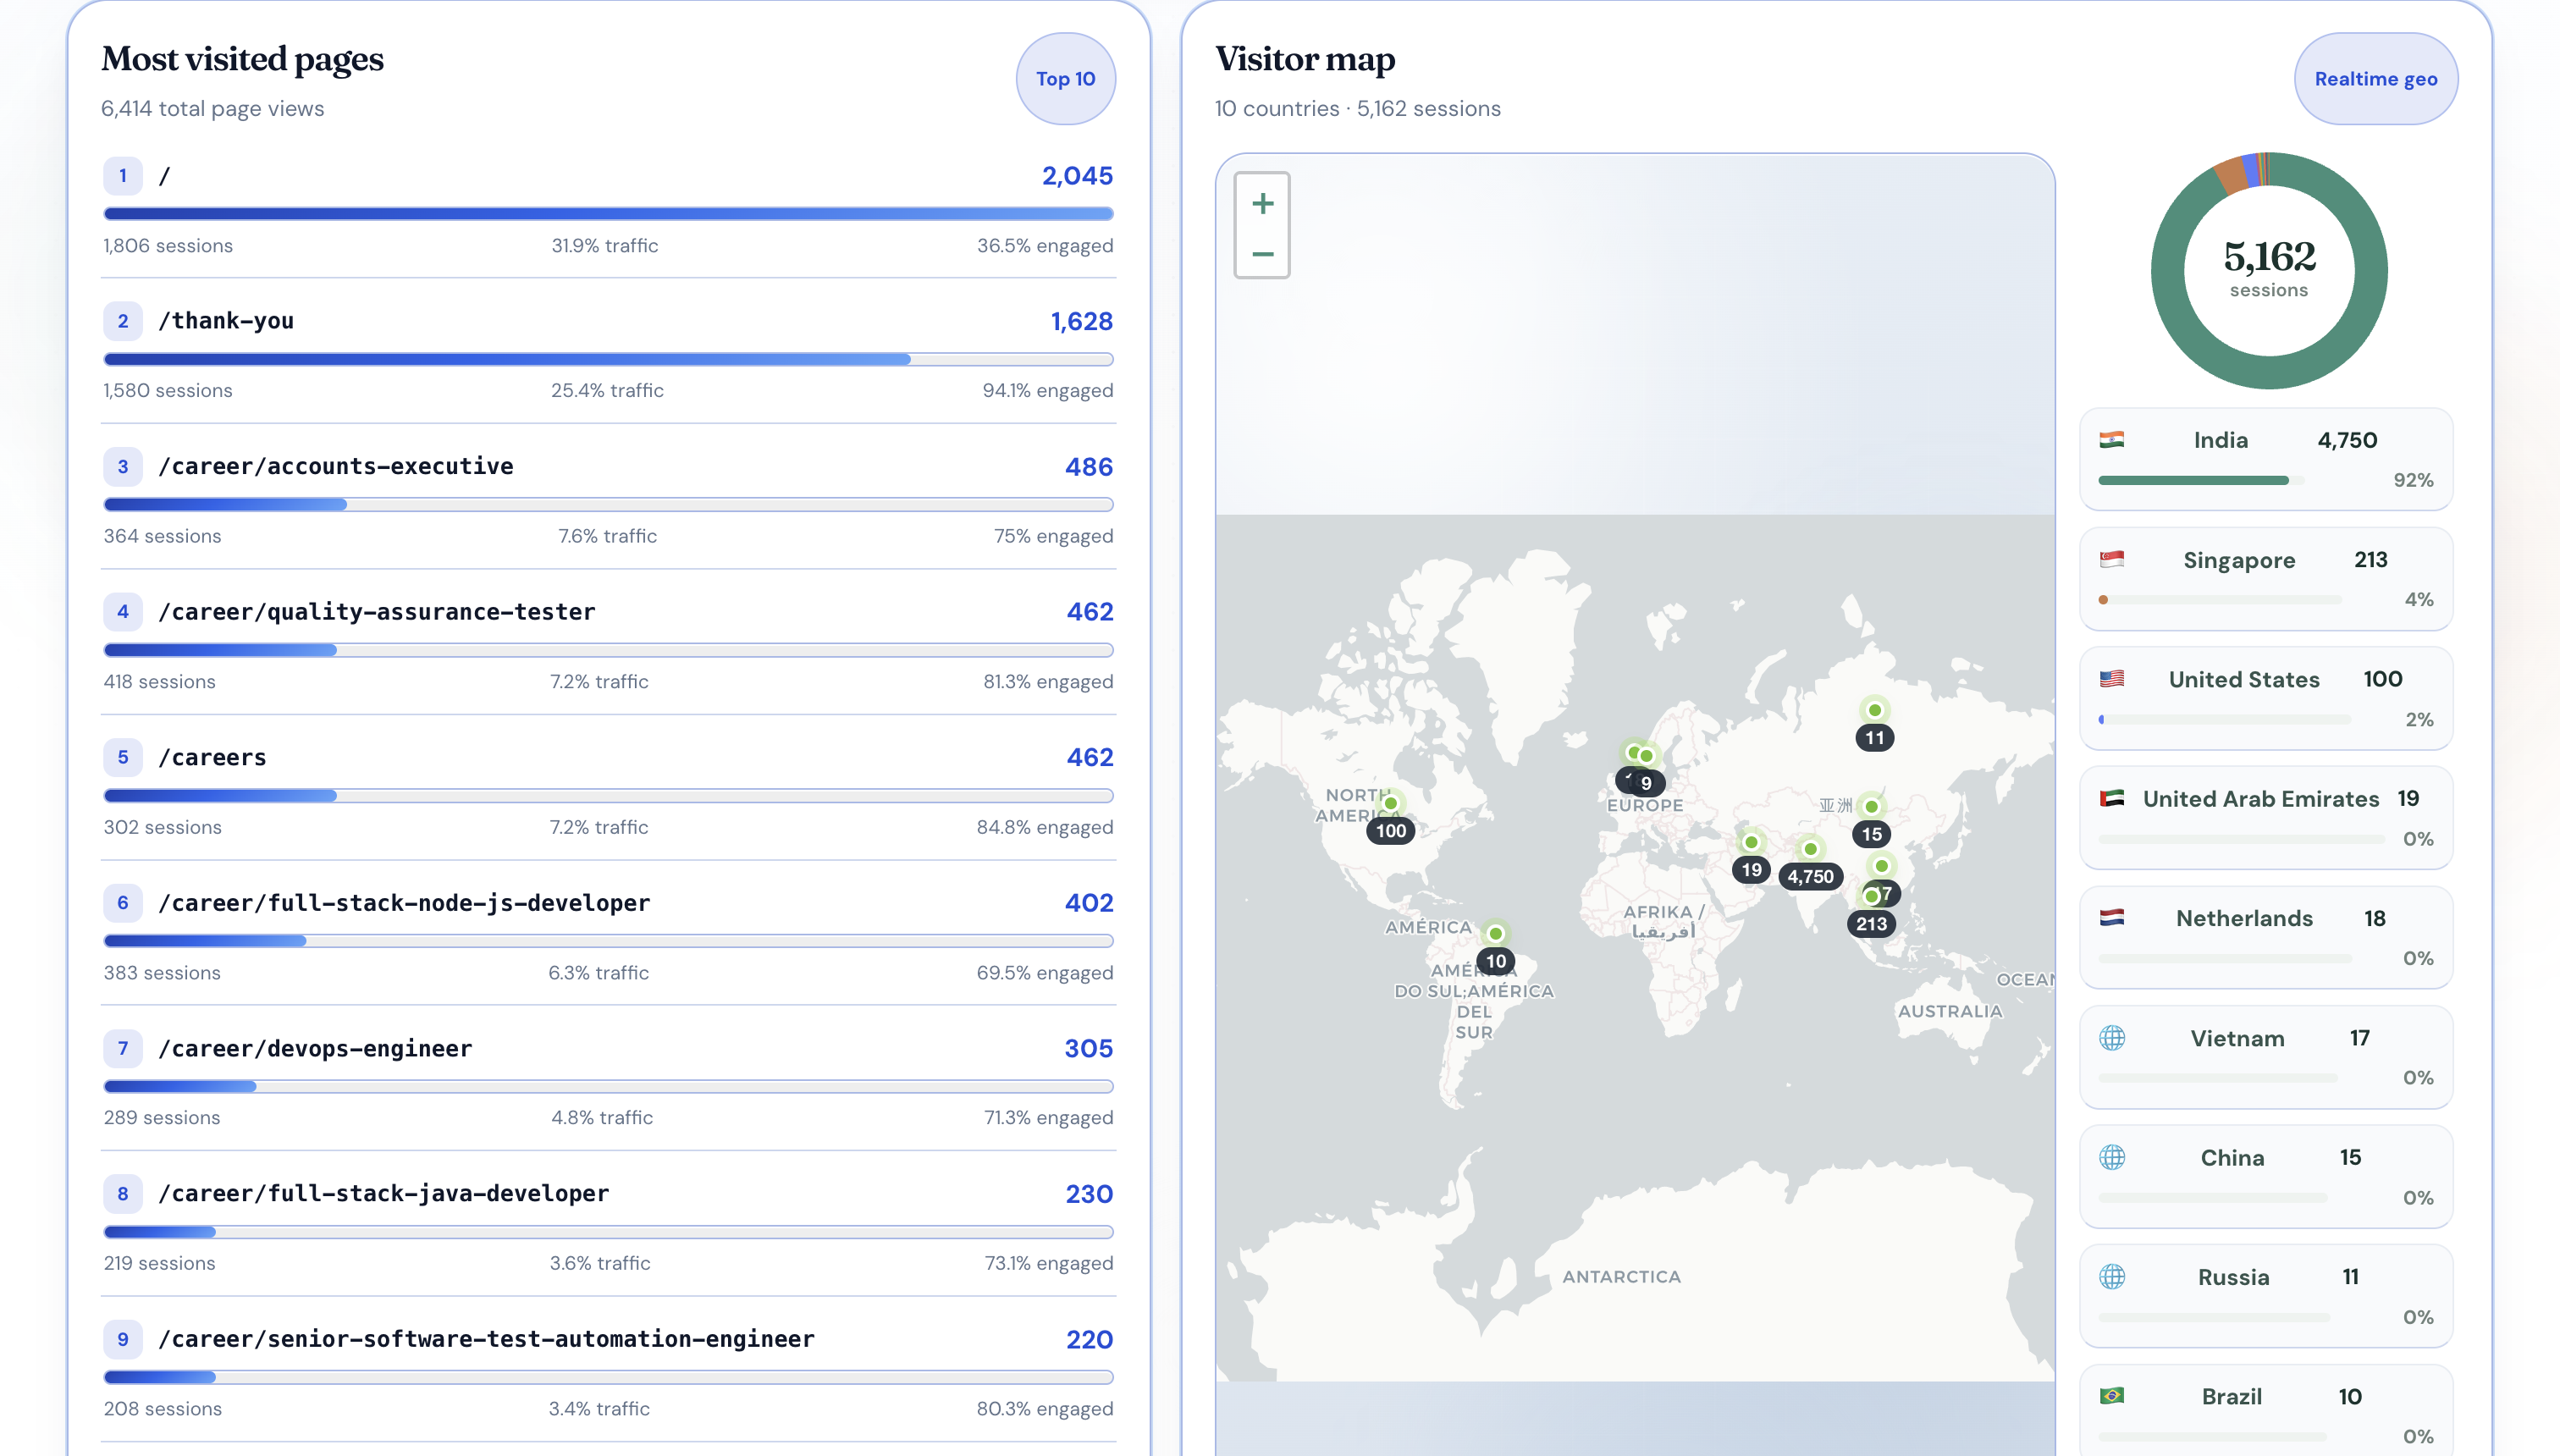
See where visitors come from with map markers, country flags, and session share bars.
Clients get a friendly weekly summary on WhatsApp — visitors, top pages, and countries. One message per site.
Top pages ranked with views, sessions, traffic share, and engagement percentage.
Six glossy accent colours — each user picks their favourite from the dashboard header.
Your client asks for Isarva Analytics, shares their mobile number — we create their account. They log in and start seeing insights. Weekly WhatsApp summaries can go out automatically.
They contact you for website analytics. Share their name, website, and mobile number — that's all they need to do.
We set up login details and assign their website(s). They receive username and password — ready to use.
They open the dashboard anytime for live visitors, maps, and trends. Plus a weekly WhatsApp summary on their phone — no extra effort.
Live dashboard, multi-site access, and weekly WhatsApp reports — all under the Isarva Analytics brand.